


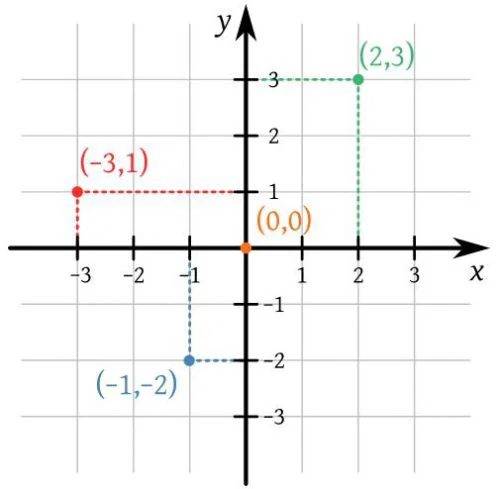
Look at two number lines. One runs horizontal. The other goes vertical. They cross. That intersection is the origin. Or zero. This setup is the Cartesian plane. You might also hear it called the coordinate system.
The goal is simple. Pinpoint a location. Every spot on the grid has a specific address. That address uses coordinates. It tells you exactly where a point sits relative to the center.
But it does more than plot dots. It analyzes shapes. You can study parabolas. Hyperbolas work on it too. Lines? Circles? Ellipses? They all live here. This is the heart of analytic geometry.
The Cartesian plane translates visual shapes into mathematical data.
Why does this matter? You need precision. Abstract math gets messy without a grid. The plane provides structure. It turns geometry into numbers. You can calculate distances. You can find slopes. You can predict curves.
Students often find this confusing at first. The axes feel arbitrary. The quadrants seem extra. But once you get the hang of it, it clicks. It’s just a map. A map for numbers.
Think about where you see this. GPS systems use similar grids. Video games render worlds on grids. Architects draw on grids. The concept is everywhere. It’s just not always labeled as such.
You don’t need to memorize everything at once. Start with the axes. Understand the origin. Then move to plotting points. The rest follows naturally. Practice makes it intuitive.
Does it feel rigid? Maybe. But that rigidity is its strength. It creates order. It allows for exactness. In a world of approximations, exactness is rare. And valuable.
How the Cartesian Plane Got Its Name
The grid you see in algebra class isn’t just a random drawing. It’s named after René Descartes, the French philosopher and mathematician who essentially invented modern coordinate geometry. He was the first to map points using a system of axes, turning abstract shapes into numbers. Before him, geometry and algebra were mostly separate worlds. He bridged them.
Elements of the Plane
To actually use the plane, you need to know its parts. It’s built on four main components: the coordinate axes, the origin, the quadrants, and the coordinates themselves. Let’s break them down so they stick.
Coordinate Axes
The foundation of the entire system is the two perpendicular lines that intersect. They are called the x-axis and the y-axis.
Think of them as a crosshair. The horizontal line is the x-axis. The vertical one is the y-axis. Where they meet? That’s the starting point for everything. These lines divide the plane into four distinct sections. They provide the reference frame that lets you pinpoint any location in space with just two numbers.
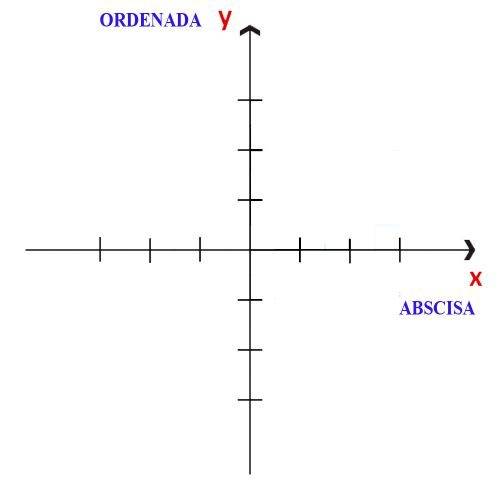

Los ejes coordenados no son más que dos líneas rectas que se cruzan en un ángulo perfecto de noventa grados. Se cortan en un solo punto del plano. Ese cruce crea la estructura básica para ubicar cualquier cosa en un espacio bidimensional. La línea que va de lado a lado se llama abscisa. La que sube y baja es la ordenada.
La abscisa es horizontal. Siempre se identifica con la letra x. Piensa en ella como la línea del horizonte. La ordenada es vertical. La representa la letra y. Es la línea que marca la altura. Juntas, estas dos rectas perpendiculares forman el mapa que necesitamos para leer gráficos, dibujar funciones o simplemente saber dónde está algo en un plano.
Si quieres entender bien la geometría básica, ten en cuenta cómo se definen las direcciones. La horizontal sigue el eje x. La vertical sigue el eje y. Son conceptos distintos pero relacionados. Las líneas perpendiculares son la regla que mantiene todo en su sitio.
Origen o punto 0
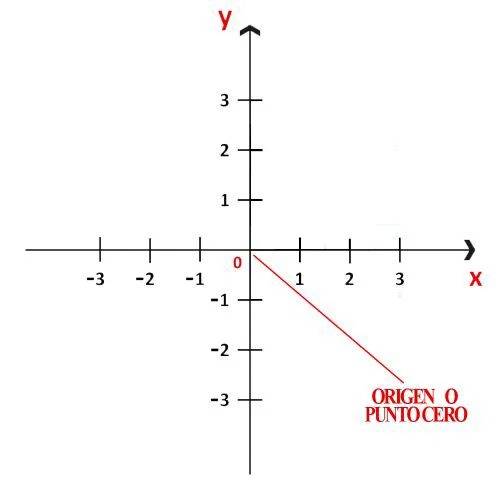
El punto donde se intersectan la abscisa y la ordenada tiene un nombre específico. Se llama origen. Es el punto cero. Aquí es donde empieza todo. Las coordenadas en este punto son (0, 0). No hay desplazamiento hacia la derecha ni hacia arriba. Está en el centro absoluto del sistema cartesiano.
Es el ancla. Si te mueves a la derecha del origen, tus valores en x son positivos. Si te mueves a la izquierda, son negativos. Lo mismo pasa con la vertical. Arriba del origen, la y es positiva. Abajo, es negativa. Este punto cero es la referencia inicial. Sin él, no tendrías un lugar fijo desde donde medir distancias o trazar curvas.
La claridad visual ayuda. Imagina una hoja de papel. Traza una línea horizontal. Traza otra vertical que la corte por la mitad. El cruce es tu origen. Todo lo demás se construye a partir de ahí.
Cuadrantes del plano cartesiano
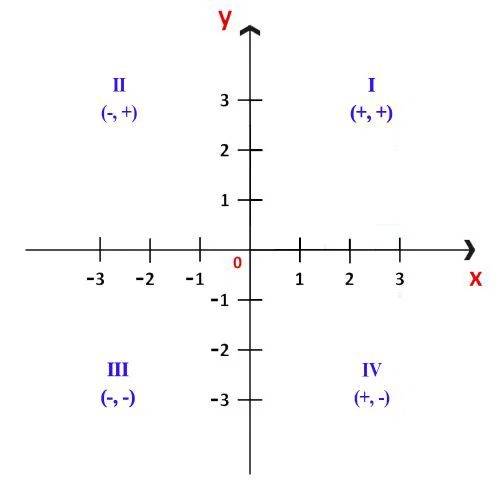
The grid doesn’t just stop at the lines. Once those perpendicular axes intersect, they slice the flat surface into four distinct zones. These are the quadrants. They aren’t arbitrary. They exist because of how we define positive and negative space around that central origin.
Think of it like a map. You’re standing at the center. Look right? That’s positive territory. Look up? Also positive. But go left? Suddenly you’re in the negatives. Go down? Same thing. This creates a specific logic for every point on the graph.
The quadrants are labeled with Roman numerals, but they don’t start at one. They start at the top right. Why? History. And convention. It’s just how mathematicians agreed to count.
Here is how they break down:
Quadrant I: The Happy Place
Top right. Both x and y are positive. If you see a point like (3, 5), it lives here. Everything is above and to the right of the origin. Simple.
Quadrant II: The Left Turn
Top left. Here, x is negative. y is still positive. You moved left from the center, but stayed up. A point like (-2, 4) belongs here.
Quadrant III: The Bottom Left
Now both are negative. You went left (negative x) and down (negative y). It’s the mirror image of Quadrant I, but flipped across both axes. (-3, -5) sits here.
Quadrant IV: The Bottom Right
Mixed bag. x is positive (right), but y is negative (down). This is where things get interesting for graphing functions. A point like (4, -2) lands here.
Why the Quadrants Matter
It’s not just about labeling. It’s about direction. When you plot a line, the quadrant tells you the slope’s behavior. A line starting in Quadrant I and moving toward Quadrant III? That’s a positive slope. It’s climbing as it goes right. Move from Quadrant II to IV? Negative slope. Dropping as it moves right.
Without these zones, coordinates are just numbers. With them, they become location data. They tell a story about movement and position.
How to Identify Your Quadrant
Need to know which zone a point belongs to? Check the signs.
- Look at the x-coordinate. Is it positive or negative?
- Look at the y-coordinate. Is it positive or negative?
- Match the pair to the grid.
Positive/Positive = Quadrant I
Negative/Positive = Quadrant II
Negative/Negative = Quadrant III
Positive/Negative = Quadrant IV
It seems mechanical. It is. But once you internalize it, your brain does it instantly. You see (-1, 3) and you know it’s top left before you even draw the line.
The Axes Themselves
Here’s a trick question for the test: Is the origin in a quadrant?
No.
Points that lie exactly on the x-axis or y-axis don’t belong to any quadrant. They’re on the border. The origin (0,0) is the intersection. It’s the threshold. If a point has a
Understanding Quadrants and Coordinates
To map any location on a flat surface, you need a grid. That grid is created by two perpendicular lines crossing each other. This intersection splits the plane into four distinct sections known as quadrants. Think of these as the four rooms of a house, where every point in the entire plane must live in one of them.
Traditionally, we label these areas with Roman numerals, moving counterclockwise starting from the top right.
- Quadrant I : Both the horizontal value (abscissa) and vertical value (ordinate) are positive.
- Quadrant II : The horizontal value is negative, while the vertical value remains positive.
- Quadrant III : Here, both values are negative.
- Quadrant IV : The horizontal value is positive, but the vertical value is negative.
This structure isn’t arbitrary. It creates a consistent language for location. If you know which quadrant a point sits in, you immediately know the signs of its coordinates without even looking at the numbers.
How to Find Coordinates on the Cartesian Plane
Coordinates are simply the address of a point. They tell you exactly where that point is by assigning a value to the horizontal axis (x) and a value to the vertical axis (y). We write this as P (x, y).
- P represents the specific point.
- x is the abscissa, measuring left or right.
- y is the ordinate, measuring up or down.
Finding these numbers is a mechanical process. You don’t guess. You project.
Start with point P. Draw a straight line down (or up) until it hits the x-axis. This line is the orthogonal projection. The number where this line touches the x-axis is your x-coordinate.
Next, draw a line from point P horizontally until it hits the y-axis. This is the projection onto the y-axis. The number here is your y-coordinate.
These numbers can be positive or negative, depending on which quadrant the point occupies.
For example, if you have a point in the second quadrant, you know immediately that the x-coordinate must be negative and the y-coordinate positive. You draw the vertical line to the x-axis and read the negative number. You draw the horizontal line to the y-axis and read the positive number. The order matters. (x, y) is not the same as (y, x). Swap them, and you are standing in a completely different spot.
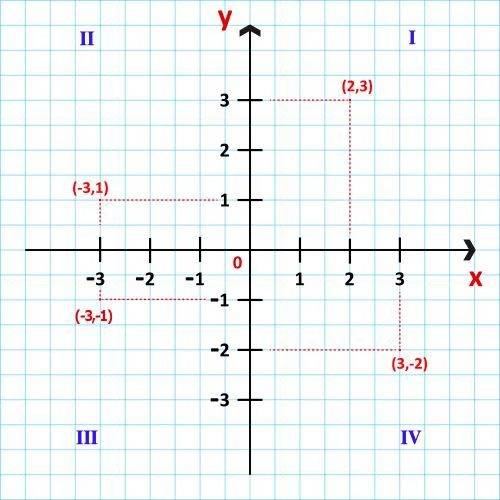
Let’s look at the actual coordinates for each section of the grid. In Quadrant I, you have point P at (2, 3). Move to Quadrant II, and the point P sits at (-3, 1). Drop down to Quadrant III, and you’ll find P at (-3, -1). Finally, in Quadrant IV, the point P is located at (3, -2).
These numbers aren’t just abstract symbols. They are instructions.
If you need to find where a specific point lives on the grid based on its coordinates, the process is mechanical but precise. You start by drawing a vertical line perpendicular to the x-axis at the first number—the abscissa. Then, you draw a horizontal line perpendicular to the y-axis at the second number—the ordinate.
Where these two lines cross is your answer. That intersection marks the exact spatial location of the point.
For example,
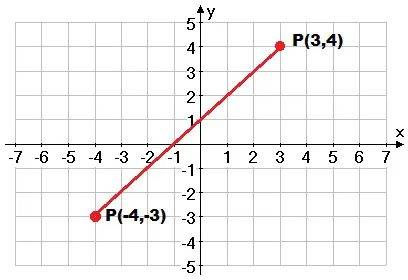

Locating points is the foundation. Take P (3,4). It sits squarely in Quadrant I. The number 3 marks the horizontal axis—the abscissa. The 4 marks the vertical axis—the ordinate. You move right, then up. That’s your spot.
Flip the signs. P (-3,-4) lands in Quadrant III. The -3 pushes you left on the x-axis. The -4 pulls you down on the y-axis. Two distinct locations. Two different rules for reading the grid.
How Functions Map Inputs to Outputs
A function written as f(x)=y isn’t just a symbol. It’s a machine. It takes an independent variable from the domain and processes it into a dependent variable in the codomain.
Look at f(x)=3x.
The rule is simple. Multiply the input by three.
| Function Input (x) | Operation | Output (y) |
|---|---|---|
| 2 | 3 * 2 | 6 |
| 3 | 3 * 3 | 9 |
| 4 | 3 * 4 | 12 |
Each input yields exactly one output. This is a biunivocal relationship. One-to-one. No ambiguity. If you feed it a number, you get a specific result. Nothing more. Nothing less.
Tabulating Points for Plotting
To graph a function, you don’t just guess. You tabulate.
You list the pairs. You order them. Then you place them on the Cartesian plane.
Consider these specific coordinates:
- X=2, Y=3 becomes point (2,3).
- X=-4, Y=2 becomes point (-4,2).
- X=6, Y=-1 becomes point (6,-1).
The table organizes the chaos. The graph visualizes the pattern.
Which method works best for your learning style? Some students prefer the table first. Others plot immediately. The math doesn’t care about your preference. It cares about accuracy.
Start with the axes. Find the intersection. Mark the point. Repeat.
The plane waits for no one.

